Three ways to measure liberal democracy in the world
When we take into account its relative size, the power of liberal democracy in the world is much weaker than it might seem
Democracy reports have launched in 2022 the warn that liberal democracy is suffering a dramatic decline. Their titles are appalling: The Global Expansion of Authoritarian Rule and Democracy Report 2022: Autocratization Changing Nature?. The world is experiencing a wave of autocratization, driven by the decline of the democratic credentials both in developing countries like Turkey, Myanmar, and Afghanistan and in relatively wealthy democracies such as the United States, Slovenia and Poland. Putin’s war is also positing a threat to the free world (see Fukuyama 2022, Putin’s war on the liberal order). Despite the existence of a democratic backsliding is undisputed, assessing how much the world is becoming less democratic is much more complex. This note uses the V-Dem Liberal Democracy Index (version 12, 2022) to show three different ways to measure the evolution of liberal democracy in the world. In the graphs below, we observe that the democratic decline is much stronger and worrying when we take into account its relative size.
By country
The simplest form to measure the presence of democracy in the world tends to be through binary measures. If we know how many democracies are in the world, we simply sum them and divide the result by the total number of countries. This gives the percentage of democracies in the world. The operation, however, is more complicated -at least to interpret- when we deal with gradual measures of democracy, which are the most frequent available metrics that provide the most recent reports. Gradual measures do not divide the world dichotomously between two categories (democracies and not democracies), but provide numeric measures that range between a maximum and a minimum. Freedom House’s Freedom in the World Index ranges between 0 and 100, the Economist Democracy Index between 0 and 10, and the V-Dem indices between 0 and 1. In all cases the upper number always indicates a higher degree of democracy. These reports often provide some categorizations derived from these quantifications (The Economist distinguishes between Full democracies, Flawed democracies, Hybrid, and Authoritarian regimes), but normally these categories are conceptually somewhat arbitrary.
Numeric indicators can also provide a neat picture of the presence of liberal democracy in the world. The next Figure 1 shows the mean of the V-Dem liberal democracy index, taking countries as units. This calculation simply sums the degree of liberal democracy in every country and divides the result by the number of cases. As the last V-Dem report has already emphasized, we observe that liberal democracy reached its pick in 2012 and after that has suffered a deterioration. The decline has been more severe in the last two years, and territorially, it has affected specially developed regions where liberal democracy was widespread such as North America and Europe.
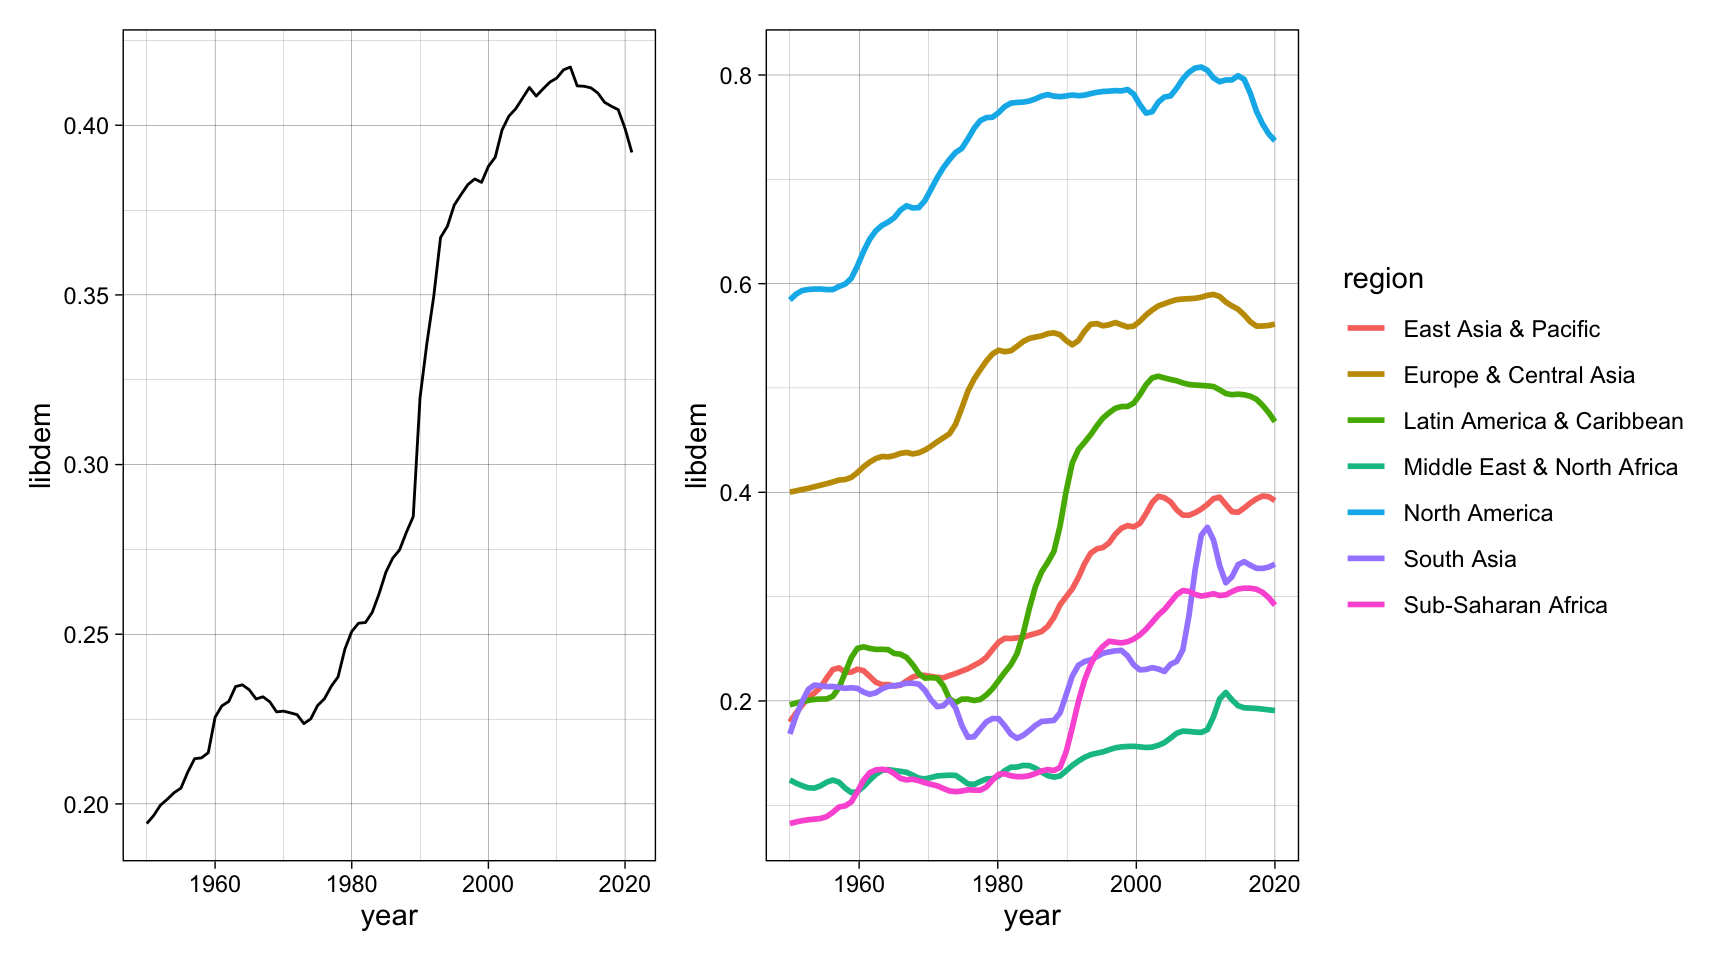
Figure 1: Democracy in the world, by country (1950-2021)
By population
Another option would be to look at the number of people that live in under a liberal democratic regime. This is a different calculation from the previous one, since it does not treat all states as equal units, but it uses their population to weight the contribution to the final measure. Figure 2 shows that, historically, democracy reached a ‘bottom peak’ in 1975, when civil liberties were suspended in the populated India. After that, several democratization waves, first in Latin American and European Mediterranean countries, and afterwards in Eastern Europe, conduced to an unprecedented expansion of liberal democracy, reaching a maximum spread at the beginning of the 21st century. Its decline started near 2012 and now the world is back to the 1990 levels.
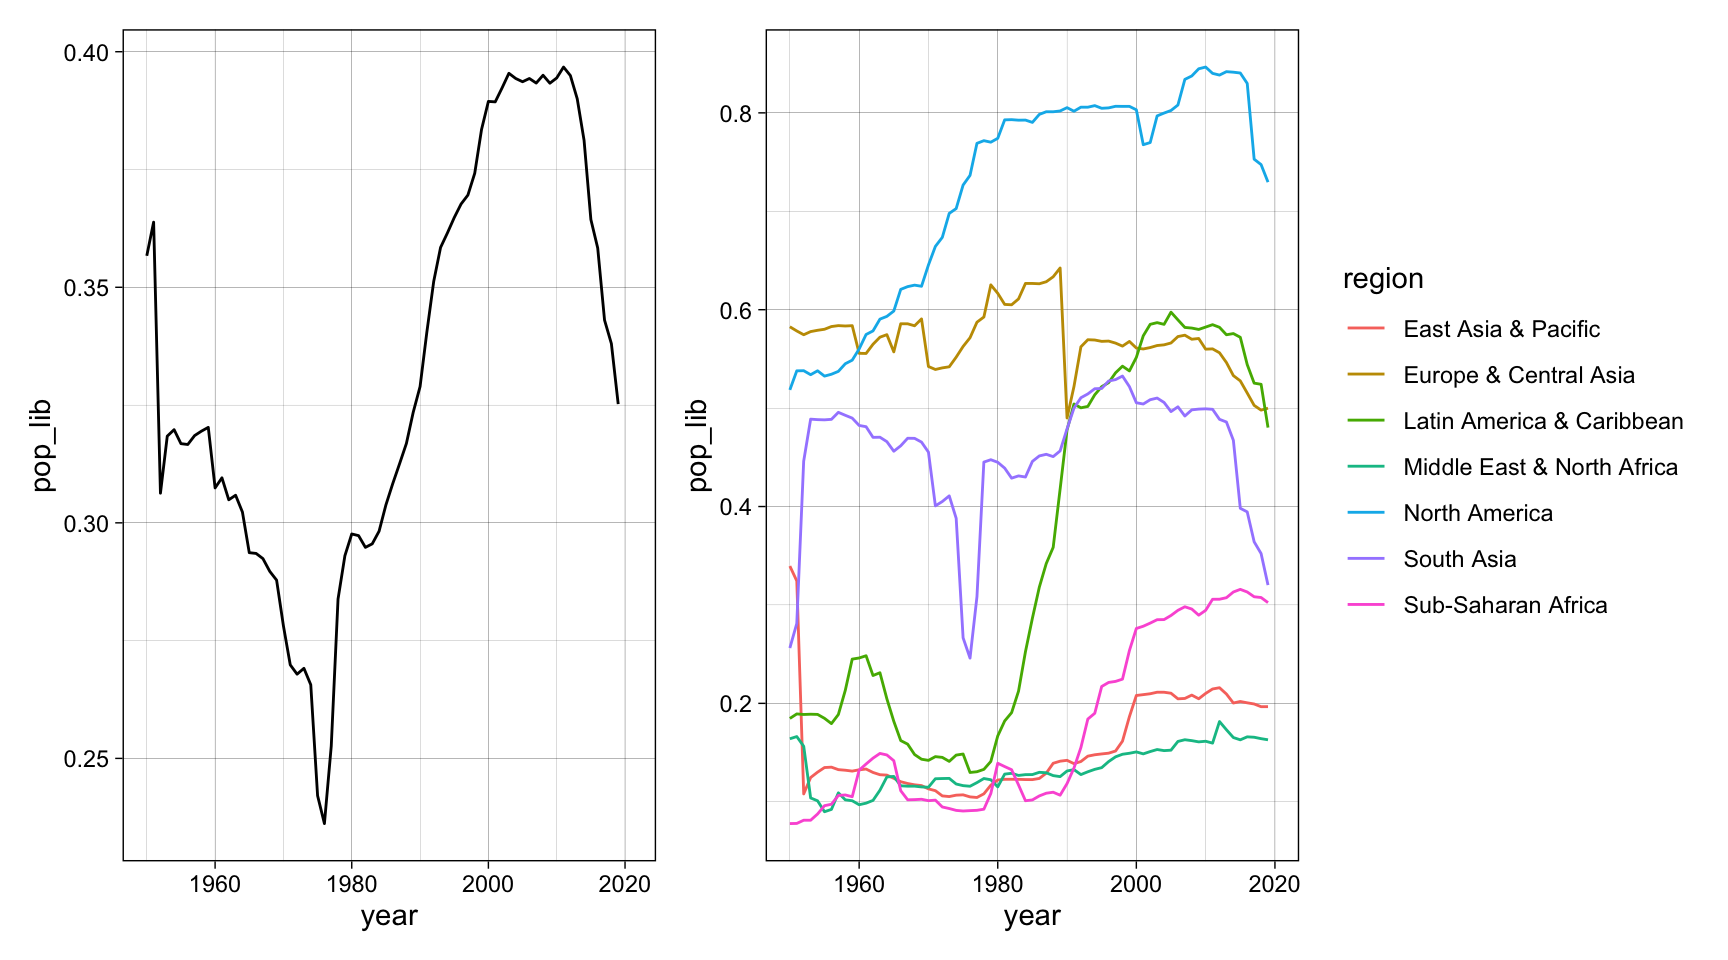
Figure 2: Democracy in the world, by population (1950-2021)
By GDP
Scholars in international relations can also be interested in the power – the relative weight – that liberal democracy has in world politics. Democracy in larger economies can be definitely more influential than in small economies, which may make its values to spread easily across the world. A way to measure this can be obtained by multiplying each country’s V-Dem Liberal Democracy index by its GDP and dividing the sum by the world’s GDP. The results in Figure 3 show a worrying picture for the current days: liberal democracy is in its worst moment since the World War II. Its growth was more or less sustained since 1950 and reached its peak in the year 2000. Since then, it has suffered a dramatic decline, reaching unprecedented levels since the beginning of the world liberal order.
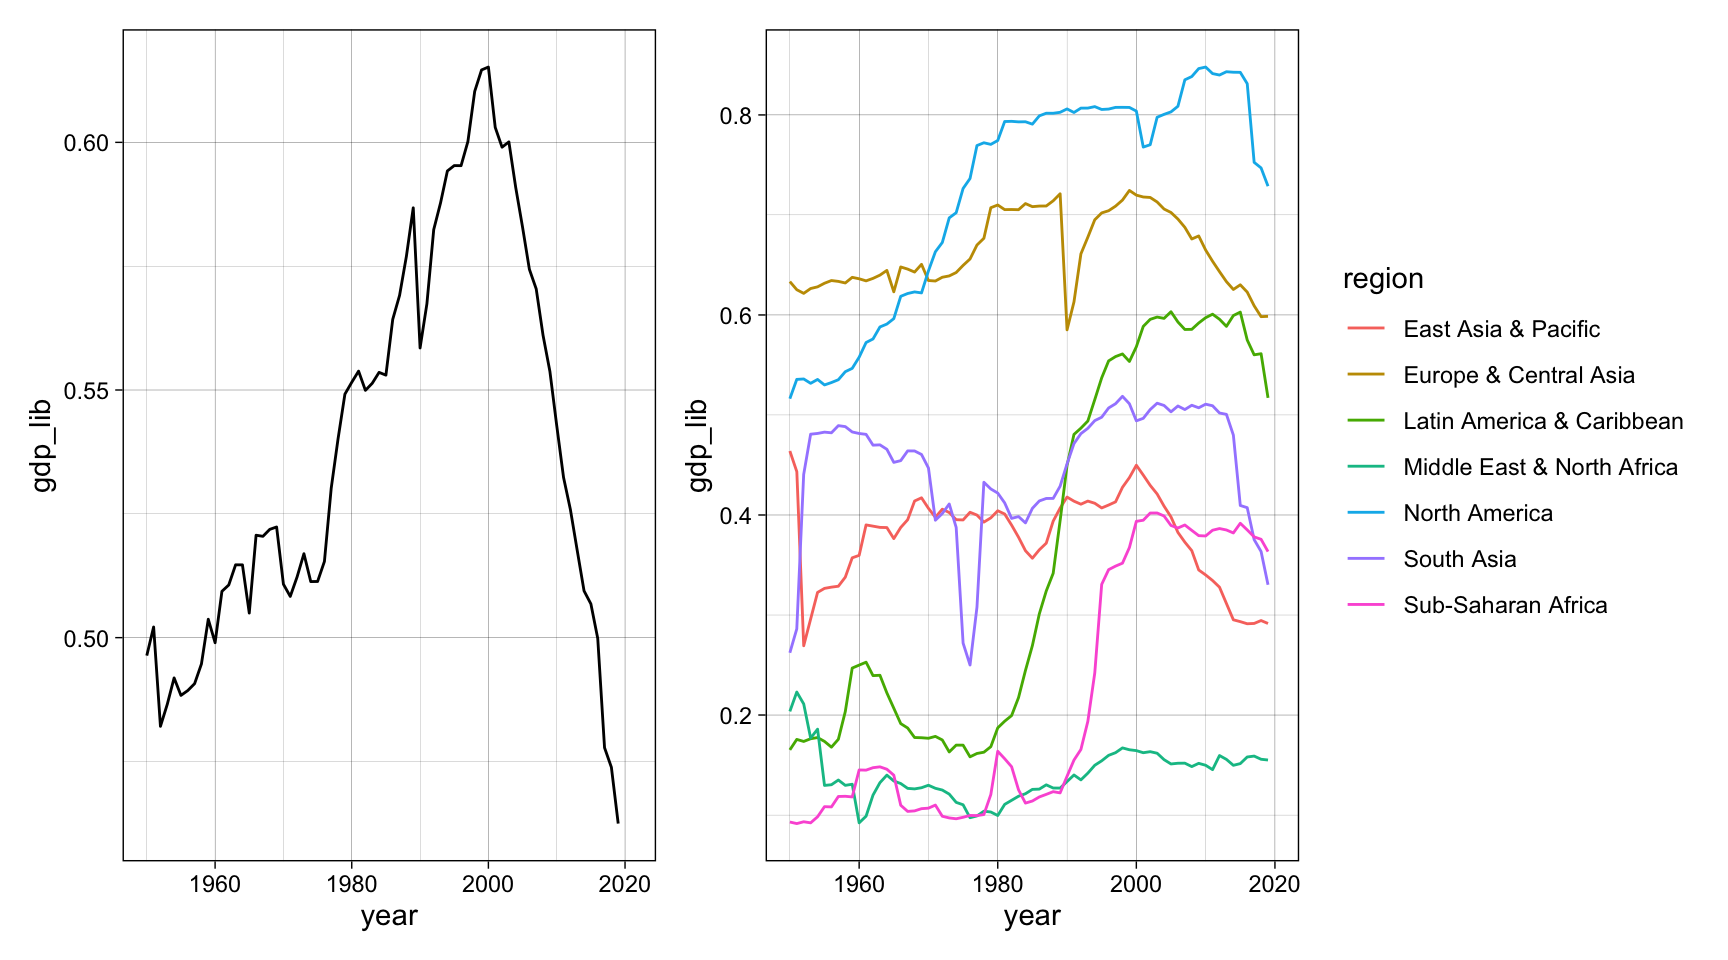
Figure 3: Democracy in the world, by GDP (1950-2021)
According to this last form to measure democracy in the world, its backsliding obeys to a relative decline in three regions. In South Asia, two large countries such as India and Bangladesh have experienced almost at the same time economic growth and democratic backsliding. In East Asia & Pacific, the decline observed in the graph is explained by the economic growth of China, but not by autocratization. The rise of China has spread the leverage of autocracies in the region vis-à-vis the former dominant democratic economies: Japan, South Korea, and Australia. And in Europe & Central Asia, the decline is not explained by a relative economic growth of autocracies, but by a general wave of autocratization, led by Russia, Turkey, Poland, and Hungary.
Jordi Mas Elias
Professor of International Politics
My research interests include political economy, international politics, regionalism, and methodology in social sciences.